
For the test data set 1 – Sainte-Maxime – reference data have been provided by IGN - DRE
Nicolas Paparoditis
Directeur Scientifique
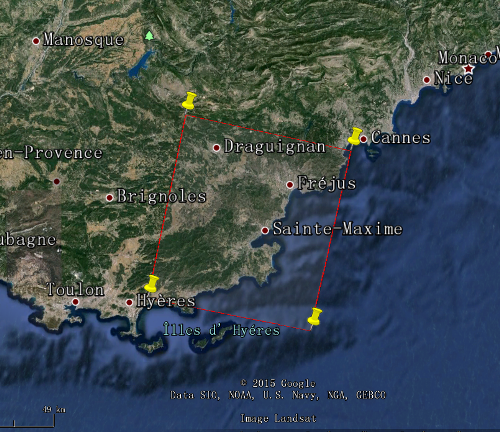
Data set 1: Sainte-Maxime
|
| Figure 1. The illustration of ZY-3 images covering Sainte-Maxime of France,
on GoogleEarth.
|
The ground control points as well a reference height model of an aerial image block have been made available together with image sketches in French Lambert 93 coordinate system. The data sets have been transformed to UTM coordinates by ISPRS WG I/4. To simplify the handling of the benchmark test, the scene pixel coordinates are provided together with ground coordinates of the ground control points (GCP) below. With 12 GCP the sigma0 of the single scene orientation based on bias corrected RPC-solution is in the range of 1.6m up to 2.6m RMS. This corresponds to the accuracy of the control point definition in the images.
|
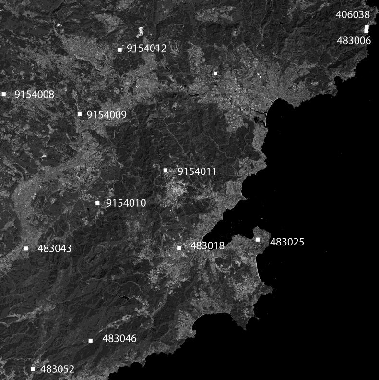
| Location of GCP in the nadir scene (navp) |
Ground control point coordinates (UTM, WGS ellipsoid, height related to geoid) :
   406038  32332668.498  4816628.783   50.620
   483006  32332460.841  4816123.659  107.130
   483018  32300665.265  4794192.126   59.870
   483025  32311211.168  4792607.508   52.110
   483043  32280703.704  4799367.120  232.210
   483046  32285974.773  4785157.789  154.860
   483052  32277446.301  4783382.588  127.430
  9154008  32282968.619  4820287.098  283.500
  9154009  32292199.291  4815077.513  256.450
  9154010  32291536.272  4802850.345  129.640
  9154011  32301514.389  4804823.826  257.090
  9154012  32299622.476  4822102.637  302.320
  9154014  32314131.053  4826074.590  360.990
| |
bavp |
navp |
favp |
| Point name |
column |
line |
column |
line |
column |
line |
| 406038 | 15217.000 | 1764.667 | 23696.333 | 1773.667 | 15665.000 | 1768.000 |
| 483006 | 15195.000 | 1911.667 | 23662.000 | 2034.667 | 15644.000 | 1929.333 |
| 483018 | 7390.000 | 10179.667 | 11552.333 | 16056.000 | 7817.000 | 10204.333 |
| 483025 | 10663.333 | 9852.000 | 16631.000 | 15507.333 | 11099.333 | 9886.000 |
| 483043 | 1020.667 | 10196.333 | 1673.000 | 16085.000 | 1429.667 | 10225.333 |
| 483046 | 3699.000 | 13691.667 | 5825.333 | 22026.667 | 4114.667 | 13739.333 |
| 483052 | 1287.000 | 14798.000 | 2082.667 | 23887.667 | 1696.333 | 14828.667 |
| 9154008 | 78.000 | 4327.333 | 209.333 | 6116.333 | 483.000 | 4331.667 |
| 9154009 | 3240.000 | 5078.333 | 5115.000 | 7407.333 | 3655.000 | 5103.667 |
| 9154010 | 3989.333 | 8474.000 | 6278.333 | 13154.333 | 4406.000 | 8488.667 |
| 9154011 | 6819.333 | 7199.333 | 10668.333 | 11027.667 | 7244.000 | 7254.667 |
| 9154012 | 4915.333 | 2621.667 | 7715.667 | 3251.000 | 5334.667 | 2656.667 |
| Pixel positions of control points in the three images |
|
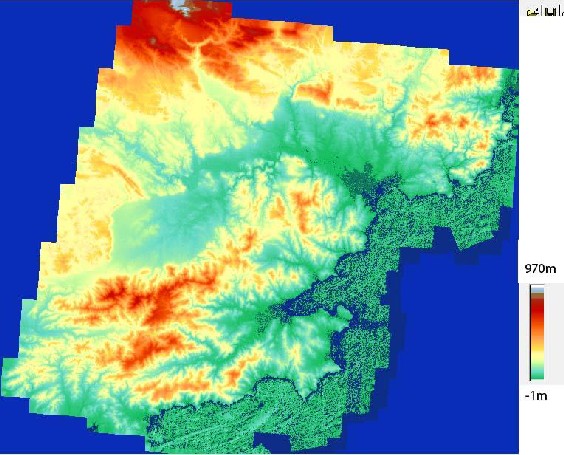
| Reference DSM based on French DSM from very high resolution aerial images – reduced from 0.4m to 10m point spacing and transformed from Lambert to UTM coordinate system – the height values in the sea are not realistic, but the shoreline can be identified |
Available with 10m point spacing as: DSMreferenceUTM32.tif 32 bit, 176 Mb
UTM zone 32 points without height values have height -9999
On request as: utmall10.asc as ASCII-file with 1.2 Gb
tfw-file:
10.000000
0.000000
0.000000
-10.000000
265625.000000
4835765.000000
Questions about reference data to: jacobsen@ipi.uni-hannover.de