ISPRS Test Project on Urban Classification and 3D Building Reconstruction: Evaluation of Building Reconstruction Results
Franz Rottensteiner
Institute of Photogrammetry and GeoInformation, Leibniz Universität Hannover, Nienburger Str.1, 30167 Hannover, Germany; E-mail: rottensteiner@ipi.uni-hannover.de
The evaluation of building reconstruction results is based on an expansion of the method described in (Rutzinger et al., 2009). The software used for evaluation reads the reference and the roof plane detection results, converts them into a label image and then carries out the evaluation as described in the paper. When generating the label image, each pixel is assigned to the highest roof plane available at the respective X,Y position. The correspondence analysis between the roof planes is carried out in the same way as described for a comparison of object detection results in (Rutzinger et al., 2009). The output consists in a text file containing the evaluation results and in a few images that visualize these results.
Interpretation of the images:
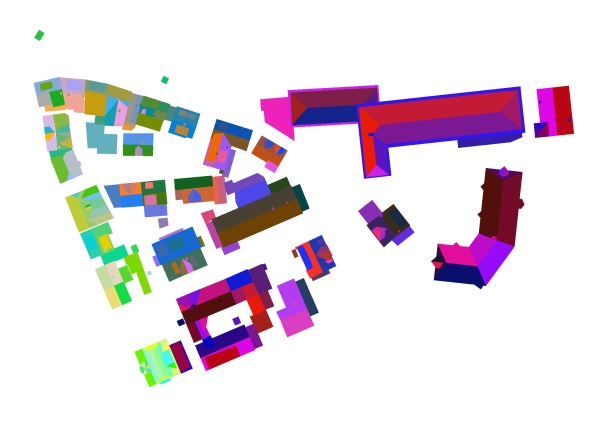
reference_labels.tif: the label
image corresponding to the reference.
Example:
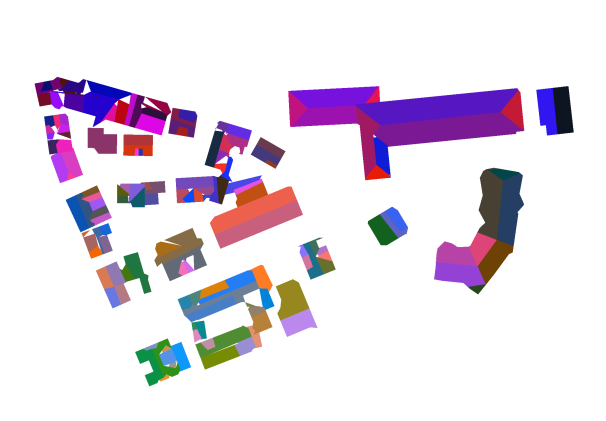
results_labels.tif: the label
image corresponding to the roof reconstruction results.
Example:
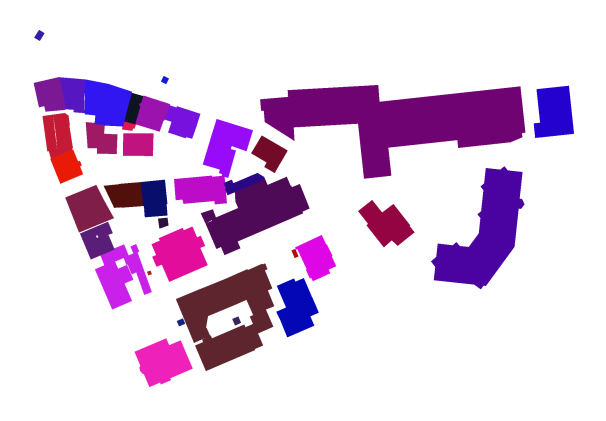
roofDetect_reference_labels.tif: the roof
detection results as a label image.
Example:
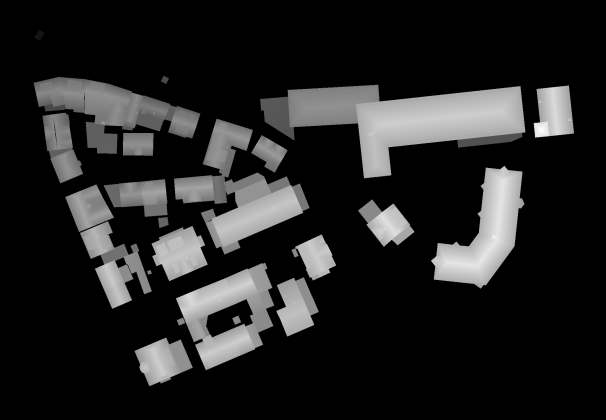
DSM_reference.tif, DSM_results.tif: Digital
surface models derived from the roof planes of the results and the
reference, respectively.
Examples:
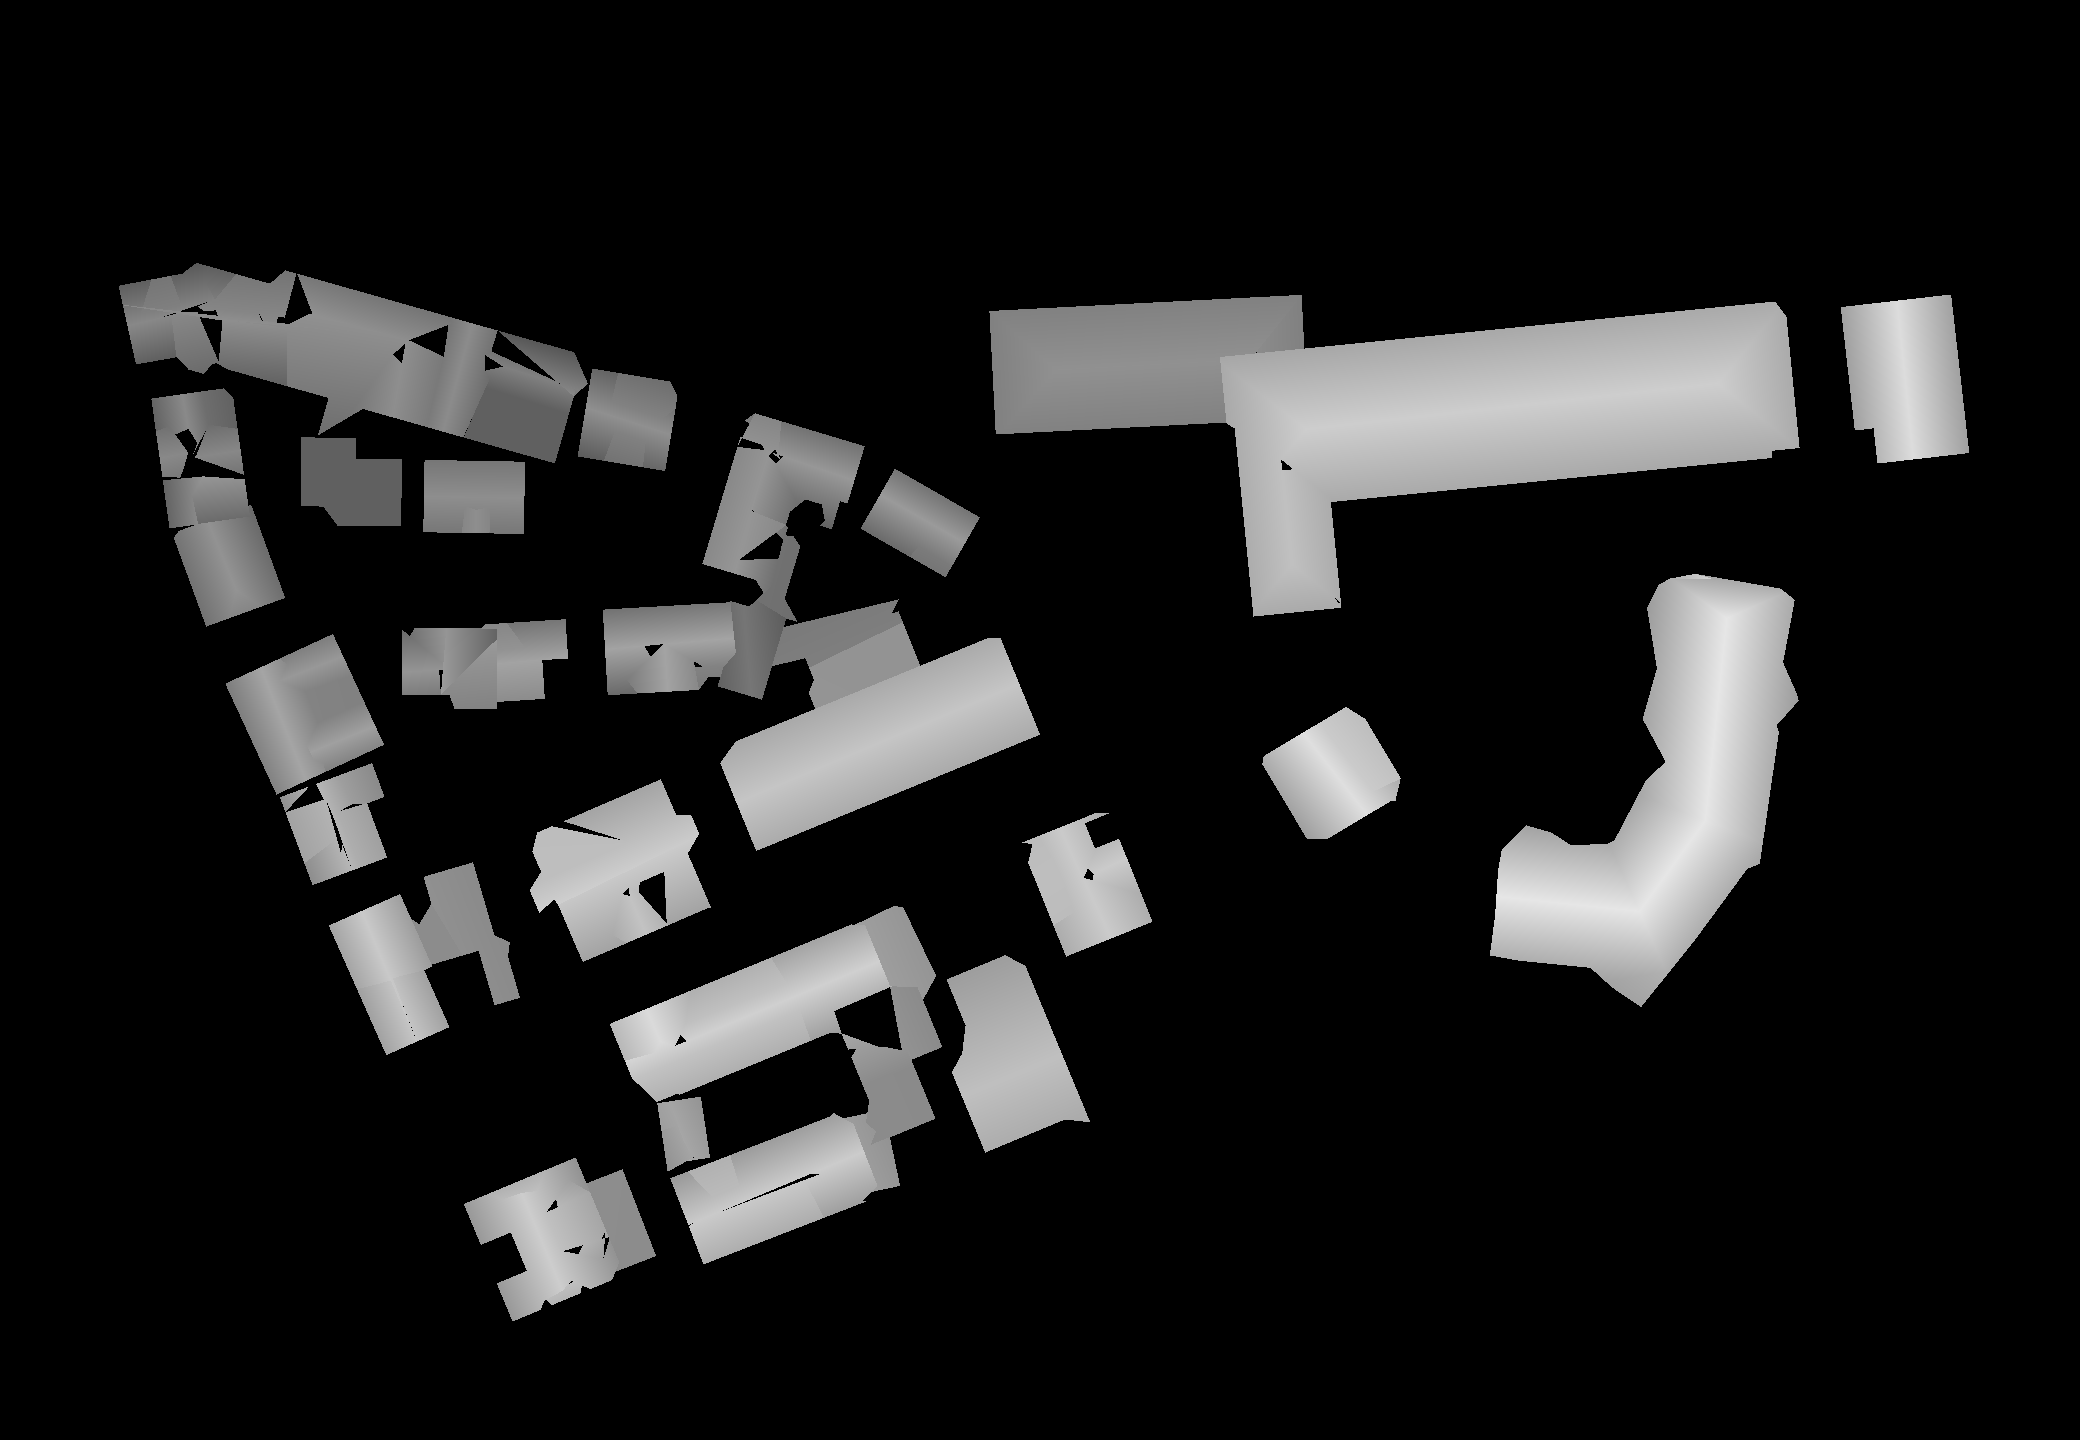
Difference_DSM.tif: Difference
between the two digital surface models defined above. The difference is
only evaluated for pixels where a plane was found in both data sets;
all other pixels are displayed in white.
Examples:
Scale [m]:
<1,27 m 0
m > 1.27 m
![]()
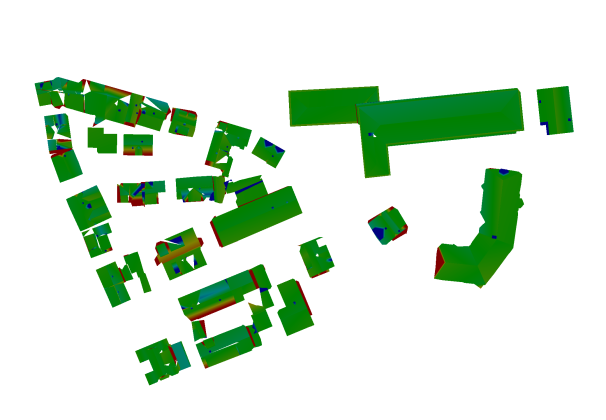
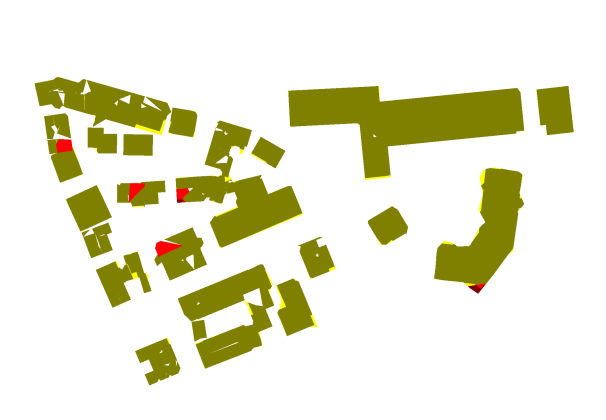
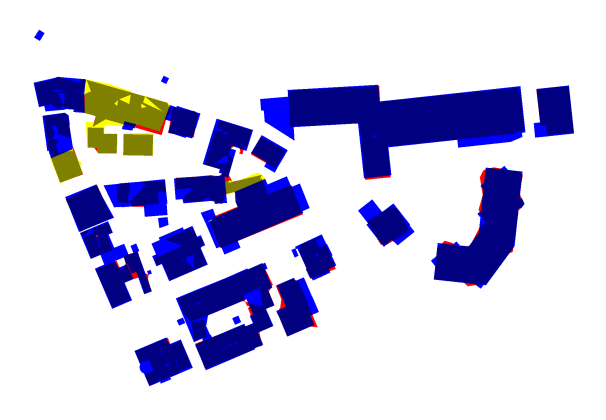
evalPix.tif: this image contains the evaluation of building detection on a per-pixel level. The meaning of the colours is:
Yellow: True positive pixels
Blue: false negative pixels
Red: false positive pixels.
Example:
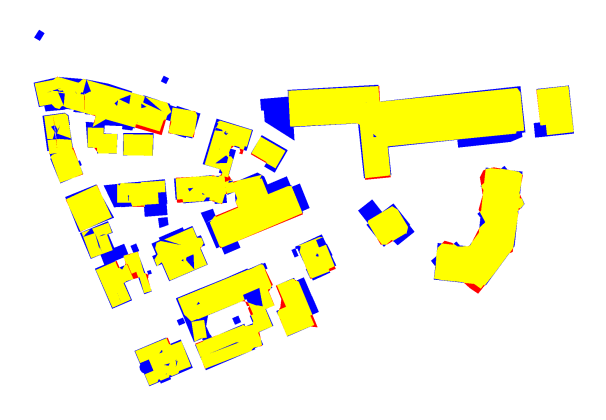
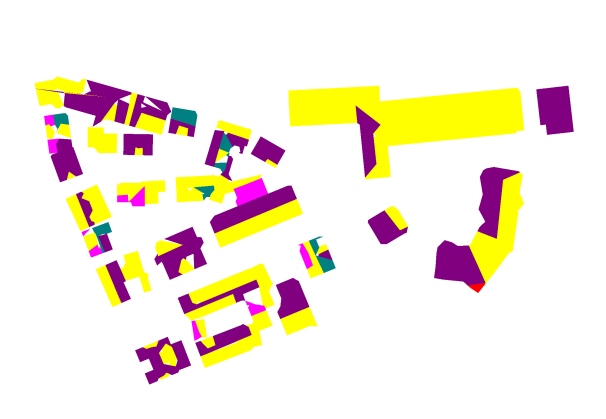
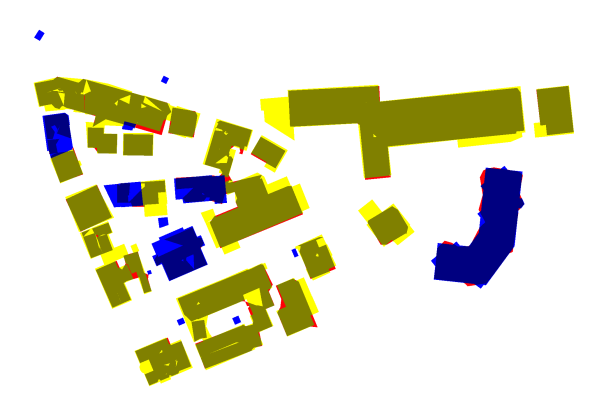
AssessTopology_reference.tif: this image contains the assessment of the topological differences between the two data sets from the point of view of the reference data. The meaning of the colours is:
Yellow: Pixels inside reference planes having a 1:1 relation to planes in the extraction results.
Blue: Pixels inside reference planes that have no corresponding plane in the extraction results.
Dark magenta: Pixels in reference roof planes that are merged with other planes in the reconstruction results (1:M relation)
Bright magenta: Pixels in reference roof planes split into to two or more planes in the reconstruction results (M:1 relation).
Dark cyan: Pixels in roof planes being part of a plane cluster having M:N relations between planes in the reference and planes in the reconstruction results.
Example:
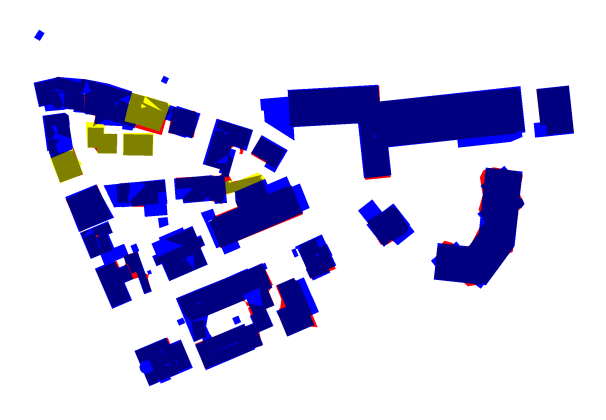
AssessTopology_results.tif: this image contains the assessment of the topological differences between the two data sets from the point of view of the detected roof planes data. The meaning of the colours is:
Yellow: Pixels inside reconstructed planes having a 1:1 relation to planes in the reference.
Red: Pixels inside reconstructed planes that have no corresponding plane in the reference.
Dark magenta: Pixels in reconstructed roof planes that correspond to several planes of the reference (1:M relation)
Bright magenta: Pixels in reconstructed roof planes that are the result of a split of a plane in the reconstruction results (M:1 relation).
Dark cyan: Pixels in reconstructed roof planes being part of a plane cluster having M:N relations between planes in the reconstruction results and planes in the reference.
Example:
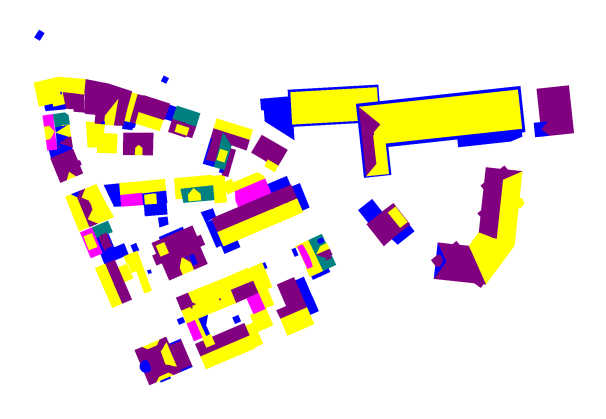
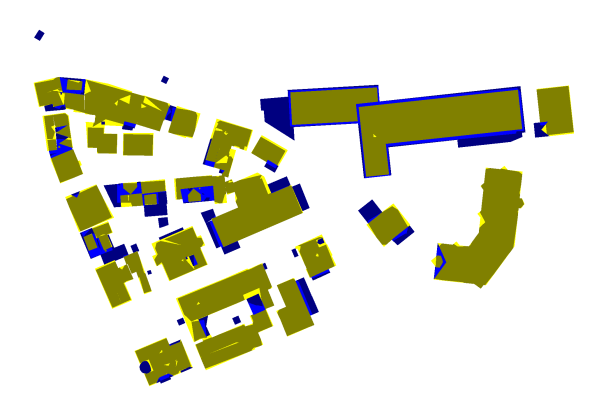
Evaluation_ReferenceRoofPlanes.tif: this image contains the evaluation on a per-roof plane level from the point of view of the reference data. The meaning of the colours is:
Ochre: Pixels available in both the reconstruction results and the reference and belonging to a reference plane found to have sufficient overlap with planes in the roof reconstruction results.
Yellow: Pixels that belong to a reference plane found to have sufficient overlap with planes in the roof reconstruction results but that are not inside a building in the reconstruction results (because the extent of the corresponding planes in the reconstruction is smaller).
Dark blue: Pixels in reference roof planes not having sufficient overlap with detected roof planes and not being inside a building in the reconstruction results
Bright blue: Pixels in reference roof planes not having sufficient overlap with detected roof planes, but being inside a building in the reconstruction results.
Example:
Evaluation_ExtractedRoofPlanes_Class.tif: this image contains the evaluation on a per-object level from the point of view of the object detection results. The meaning of the colours is:
Ochre: Pixels available in both the reconstruction results and the reference and belonging to a detected roof plane found to have sufficient overlap with planes in the reference.
Yellow: Pixels that belong to a detected roof plane found to have sufficient overlap with planes in the reference but that are not inside a building in the reference (because the extent of the detected roof plane is somewhat larger than the extent of the reference roof plane).
Dark red: Pixels in detected roof planes not having sufficient overlap with roof planes in the reference and not being inside a building in the reference
Bright red: Pixels in detected roof planes not having sufficient overlap with reference planes, but being inside a building in the reference.
Example:
completeBuildings.tif, completeBuildingsLarger.tif: Shows for which buildings all roof planes were detected. The second file shows the same thing, taking into consideration only roof planes covering an area larger than a user-specified threshold. The reason is to have a separate evaluation for larger building structures which are often easier to detect. The user specified threshold was set to 2.5 m². The meaning of the colours is:
Ochre: Pixels in buildings for which all reference roof planes were found to have correspondences of sufficient overlap in the roof reconstruction results, but only if the pixel is inside a building both in the reference and in the reconstruction results.
Yellow: Pixels in buildings for which all reference roof planes were found to have correspondences of sufficient overlap in the roof reconstruction results; however, these pixels are not inside a building in the reconstruction results.
Bright red: Pixels in correctly detected roof planes that are not inside a building in the reference.
Dark blue: Pixels in buildings for which at least one reference roof plane was not detected; these pixels are those inside a roof plane in the reconstruction results
Bright blue: Pixels in buildings for which at least one reference roof plane was not detected, and which are not inside a building in the reconstruction results.
Examples:
correctBuildings.tif, correctBuildingsLarger.tif: Shows for which buildings all detected roof planes were correct. The second file shows the same thing, taking into consideration only roof planes covering an area larger than a user-specified threshold. The meaning of the colours is:
Ochre: Pixels in buildings for which all reconstructed roof planes were found to have correspondences of sufficient overlap in the reference, but only if the pixel is inside a building both in the reference and in the reconstruction results.
Yellow: Pixels in buildings for which all reconstructed roof planes were found to have correspondences of sufficient overlap in the reference; however, these pixels are not inside a building in the reconstruction results.
Bright red: Pixels in correctly detected roof planes that are not inside a building in the reference.
Dark blue: Pixels in buildings for which at least one detected roof plane was not correct; these pixels are those inside a roof plane in the reconstruction results
Bright blue: Pixels in buildings for which at least one detected roof plane was not correct, and which are not inside a building in the reconstruction results.
Examples: (Note that in this example, the results are identical)
Interpretation of the evaluation results contained in the text file:
At the beginning, the number of roof planes found in the reconstruction results and the reference, respectively, are reported. Only objects inside the boundary polygon are considered if such a polygon is given.
Evaluation of building reconstruction results
=============================================
Number of roof planes in the reference: 288
Number of roof planes in the reconstruction results: 156 (152 inside the boundary)
This is followed by a listing of the thresholds used for classifying the overlap between roof planes in the two data sets. There are four categories of overlap (none / weak / partial / strong), based on the percentage of the area of a roof plane that is covered by the corresponding roof plane in the other data set. Note that this classification is not symmetric. Details about how the overlap is determined can be found in (Rutzinger et al., 2009) and (Rottensteiner et al., 2005). Note that in the evaluation on a per-roof-plane-level, all roof planes having an overlap larger than the threshold “weak vs. partial” (50% in the example below) with roof planes in the other data set are counted as true positives.
Thresholds for overlap criterion:
=================================
None vs Weak [%]: 10.0
Weak vs Partial [%]: 50.0
Partial vs Strong [%]: 80.0
The
geometrical accuracy of the boundary polygons for corresponding roof
planes is evaluated next. For each vertex of an extracted polygon,
the nearest point on the boundary of the corresponding roof plane in
the reference is searched. This point does not necessarily correspond
to a vertex of that polygon. The (2D) Euclidean distance d
between the corresponding points is found. If this distance is larger
than a threshold
(3 m in the example below), it is discarded.
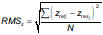
Finally, the RMS error of the distances RMSd
is computed:

A similar procedure is applied to the centres of gravity of corresponding roof planes. However, for the centres of gravity, both the RMS errors in x and y are reported, i.e.,
 and
and

In both cases, N is the number of points for which a correspondence has been found within a predefined search buffer. Furthermore, all these RMS errors are determined in both directions. Where the numbers are given for or “extracted boundaries”, the nearest point on the reference boundary was determined for each boundary polygon vertex in the extraction results. In the example below, there were 1413 boundary points in the extraction results, of which 1329 were found to have a correspondence (within 3 m) in the reference. Where the numbers are given for or “reference boundaries”, the nearest point on an extracted boundary was searched for each reference polygon vertex. In the example below, there were 6185 boundary points in the reference, of which 2349 were found to have a correspondence (within 3 m) in the extraction results. (Note that this small number is due to a large number of small objects that were not correctly detected).
Evaluation of Geometrical Accuracy:
===================================
Total RMS of extracted boundaries: 0.79 [m] (determined from 943 of 997 possible correspondences)
Total RMS of centres of gravity of extracted objects (X / Y): 0.77 [m] / 0.76 [m] (determined from 140 of 151 possible correspondences)
Total RMS of reference boundaries: 0.95 [m] (determined from 1392 of 1891 possible correspondences)
Total RMS of centres of gravity of reference objects (X / Y): 0.88 [m] / 0.96 [m] (determined from 184 of 215 possible correspondences)
Histograms are given for the RMSd errors of the roof boundary polygons. Each histogram entry gives the number of boundary polygons for which the RMSd (computed only for the points of that polygon) was in the respective bin.
Histogram of RMS of extracted boundaries, 0.05, 0.15, 0.25, 0.35, 0.45, …
, 2, 0, 1, 4, 5, …
Histogram of RMS of reference boundaries, 0.05, 0.15, 0.25, 0.35, 0.45, …
, 0, 0, 0, 0, 2, …
These histogram can be converted into a graph easily using MS Excel.
The height accuracy is determined next. It is computed as the RMS height distance of points inside corresponding planes. That is, the height accuracy is not determined from the boundary polygons, but from the vertical distances between corresponding planes at all pixels assigned to these planes:
In the equation, zrefi and zresj are two height values of points having the same planimetric position, but being situated in planes refi and resj in the reference and the results, respectively. The plane equations are used to determine these values. We determine RMSz from all pixels being assigned to a plane in both data sets (“Total RMS of height differences between planes”) and from pixels between planes found to have a substantial overlap in the two data sets (“RMS of height differences between planes found to correspond”).
Height errors: Total RMS of height differences between planes: 0.65 m^2
RMS of height differences between planes found to correspond: 0.25 m^2
After that, the topology of the two data sets is compared. This is done by checking whether planes in one data set only have one corresponding plane in the other one or not. There may be (1:0), (0:1), (1:1), (1:M), (M:1), or (M:N) relations between roof planes in the reference and objects. The number of instances of (1:1), (1:M), (M:1), or (M:N) relations are reported along with the roof plane identifiers between which they occur (note that the object identifier is encoded in the green band of the label images). For instance, in the example below, there are 83 1:1 relations, seven 1:M relations, 42 M:1 relations, and six M:N relations. The first 1:1 relation occurs between the reference roof plane 10 and the extracted roof plane 63. The first 1:M relation occurs at reference plane 49, which was split into the two extracted planes 114 and 116. The first M:1 relation occurs at the extracted plane 1, which is the result of an under-segmentation, merging the three reference planes 157, 160, and 174. The first M:N relation involves the reference planes 132, 128, and 127, which overlap with the roof planes 29 and 31 in the reconstruction results. Unlike described in (Rutzinger et al., 2009), no topological clarification is carried out here.
Comparison of the topology of the two sets of roof planes:
==========================================================
Objects with a correspondence of 1 : 1 (reference : results): 83
Ref: 10; Res: 63; Ref: 11; Res: 65; Ref: 12; Res: 68; Ref: 23; Res: 28; Ref: 24; Res: 24; Ref: 25; Res: 26; Ref: 26; Res: 23;
Ref: 30; Res: 20; Ref: 31; Res: 17; Ref: 32; Res: 19; Ref: 35; Res: 18; Ref: 42; Res: 98; Ref: 48; Res: 111; Ref: 52; Res: 115;
Ref: 61; Res: 136; Ref: 65; Res: 95; Ref: 72; Res: 71; Ref: 82; Res: 59; Ref: 83; Res: 44; Ref: 84; Res: 51; Ref: 89; Res: 45;
Ref: 95; Res: 43; Ref: 96; Res: 50; Ref: 97; Res: 72; Ref: 98; Res: 75; Ref: 99; Res: 76; Ref: 101; Res: 74; Ref: 105; Res: 108;
Ref: 107; Res: 110; Ref: 109; Res: 109; Ref: 116; Res: 78; Ref: 117; Res: 80; Ref: 118; Res: 79; Ref: 122; Res: 94; Ref: 123; Res: 93;
Ref: 124; Res: 92; Ref: 129; Res: 32; Ref: 141; Res: 6; Ref: 142; Res: 56; Ref: 143; Res: 55; Ref: 149; Res: 12; Ref: 159; Res: 13;
Ref: 163; Res: 8; Ref: 164; Res: 16; Ref: 168; Res: 14; Ref: 169; Res: 3; Ref: 170; Res: 10; Ref: 173; Res: 11; Ref: 175; Res: 52;
Ref: 176; Res: 37; Ref: 179; Res: 38; Ref: 180; Res: 40; Ref: 181; Res: 33; Ref: 190; Res: 62; Ref: 195; Res: 86; Ref: 196; Res: 89;
Ref: 197; Res: 85; Ref: 198; Res: 88; Ref: 203; Res: 87; Ref: 205; Res: 83; Ref: 207; Res: 101; Ref: 216; Res: 119; Ref: 217; Res: 118;
Ref: 219; Res: 123; Ref: 220; Res: 120; Ref: 248; Res: 150; Ref: 249; Res: 149; Ref: 250; Res: 147; Ref: 253; Res: 151; Ref: 254; Res: 148;
Ref: 260; Res: 141; Ref: 261; Res: 142; Ref: 262; Res: 143; Ref: 266; Res: 138; Ref: 271; Res: 126; Ref: 272; Res: 133; Ref: 274; Res: 130;
Ref: 279; Res: 144; Ref: 283; Res: 125; Ref: 285; Res: 124; Ref: 286; Res: 131; Ref: 287; Res: 129; Ref: 288; Res: 27;
Objects with a correspondence of 1 : M (reference : results): 7
Reference: 49 ; Results: 116 / 114
Reference: 71 ; Results: 81 / 82
Reference: 125 ; Results: 90 / 91
Reference: 185 ; Results: 35 / 36
Reference: 208 ; Results: 103 / 102
Reference: 265 ; Results: 137 / 139
Reference: 282 ; Results: 128 / 134
Objects with a correspondence of M : 1 (reference : results): 42
Results: 1 ; Reference: 157 / 160 / 174
Results: 2 ; Reference: 165 / 166 / 167
Results: 4 ; Reference: 140 / 139
Results: 5 ; Reference: 158 / 162
Results: 7 ; Reference: 156 / 155 / 154
Results: 9 ; Reference: 148 / 152 / 153
Results: 15 ; Reference: 134 / 137 / 136 / 135 / 138
Results: 21 ; Reference: 5 / 7
Results: 22 ; Reference: 6 / 8 / 4
Results: 25 ; Reference: 27 / 28
Results: 30 ; Reference: 131 / 130
Results: 34 ; Reference: 178 / 186 / 177
Results: 42 ; Reference: 103 / 91
Results: 46 ; Reference: 86 / 85
Results: 49 ; Reference: 93 / 94
Results: 53 ; Reference: 147 / 144
Results: 54 ; Reference: 146 / 145
Results: 57 ; Reference: 81 / 79
Results: 58 ; Reference: 80 / 77 / 78 / 76 / 75
Results: 60 ; Reference: 189 / 188
Results: 61 ; Reference: 191 / 192
Results: 64 ; Reference: 16 / 19
Results: 66 ; Reference: 14 / 20
Results: 67 ; Reference: 13 / 21
Results: 69 ; Reference: 9 / 17 / 18
Results: 84 ; Reference: 204 / 201 / 200 / 199
Results: 96 ; Reference: 64 / 73 / 74
Results: 97 ; Reference: 36 / 41 / 40 / 39 / 46
Results: 99 ; Reference: 43 / 38 / 47 / 37
Results: 100 ; Reference: 206 / 212
Results: 106 ; Reference: 112 / 108
Results: 107 ; Reference: 104 / 111 / 113 / 114
Results: 117 ; Reference: 53 / 54
Results: 121 ; Reference: 213 / 223
Results: 122 ; Reference: 221 / 222
Results: 127 ; Reference: 280 / 281 / 277 / 276 / 270
Results: 132 ; Reference: 273 / 275
Results: 135 ; Reference: 60 / 62
Results: 140 ; Reference: 263 / 264
Results: 145 ; Reference: 244 / 245 / 246
Results: 146 ; Reference: 252 / 251 / 247
Results: 152 ; Reference: 259 / 257
Object tuples with a correspondence of M : N (reference : results): 6
Reference: 132 / 128 / 127; Results : 29 / 31
Reference: 183 / 184; Results : 41 / 39
Reference: 87 / 90; Results : 47 / 48
Reference: 102 / 100; Results : 73 / 77
Reference: 209 / 211; Results : 105 / 104
Reference: 56 / 55; Results : 113 / 112
This is followed by a histogram of the area overlap of roof planes, given both for the reference and for the reconstruction result. Any entry in the histogram is the number of roof planes for which the percentage of their areas covered by planes in the other data sets corresponds to the respective bin.
Histogram of overlap of reference roof planes
=============================================
Histogram of overlap of reference roof planes, 2.5, 7.5, 12.5, 17.5, …
73, 0, 0, 0, …
Histogram of overlap of detected roof planes
============================================
Histogram of overlap of detected roof planes , 2.5, 7.5, 12.5, 17.5, …
1, 0, 0, 0, …
Again, these histogram can be converted into a graph easily using MS Excel.
Now, the results of the evaluation are finally reported. Evaluation is carried out on a per-area level, on a per-roof-plane level, on a per- roof-plane level balanced by area, and on a per-building level. In all cases, the completeness, the correctness, and the quality of the results are determined:
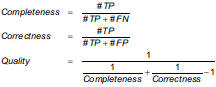
In these equations, #TP, #FN, and #FP are the numbers of true positives, false negatives, and false positives, respectively. First, the results of the per-area evaluation are given. Here, the numbers of pixels belonging to the categories mentioned above are counted. First, the numbers of true positive, false negative, false positive, and true negative pixels are given. After that, the evaluation indices are presented. The per-area evaluation actually evaluates the results of object detection, not the evaluation of roof plane extraction.
Evaluation on a per-area level (pixel size: 0.100 m)
=====================================================
Number of object pixels (reference): 652721( 6527.2 m^2)
Number of object pixels (detection results): 559881( 5598.8 m^2)
Number of true positives: 549104( 5491.0 m^2)
Number of false positives: 10777( 107.8 m^2)
Number of false negatives: 103617( 1036.2 m^2)
Number of true negatives: 2331702( 23317.0 m^2)
Per-area completeness: 84.1%
Per-area correctness: 98.1%
Per-area quality: 82.8%
This is
followed by the evaluation on a per-roof-plane level. In this
context, a roof plane is considered to be a true positive if a
certain minimum percentage of its area is covered by roof planes in
the other data set. That is, even if the roof plane is subject to an
over-segmentation or to an under-segmentation, it may still be
counted as a TP. Note that this definition is not symmetric, so that
the number of true positives is different for the two data sets.
First, the numbers of true positive, false negative, false positive,
and true negative roof planes are given. After that, the evaluation
indices are presented. Firstly, they are given on a purely
object-based level. Secondly, the per-object evaluation is balanced
by the object area. That is, each object is weighted by its total
area; an object only covered by, say, 70% would be counted with 100%
of its area. Thirdly, the per-roof plane quality numbers are also
provided for all objects covering an area larger than
10 m2.
These numbers are supposed to be representative for the most relevant
roof structures.
Evaluation on a per-roof plane level (Threshold for classification as a true positive: 50.0%
============================================================================================
Number of roof planes (reference): 288( 6527.2 m^2)
Number of detected roof planes: 152( 5598.8 m^2)
Number of true positive reference roof planes: 208( 5437.1 m^2)
Number of true positive detected roof planes: 147( 5505.0 m^2)
Number of false positives: 5( 93.8 m^2)
Number of false negatives: 80( 1090.1 m^2)
Per-roof plane completeness: 72.2%
Per-roof plane correctness: 96.7%
Per-roof plane quality: 70.5%
Per-roof plane completeness balanced by area: 83.3%
Per-roof plane object correctness balanced by area: 98.3%
Per-roof plane object quality balanced by area: 82.1%
Per-roof plane completeness for objects larger than 10.0 m^2: 77.7%
Per-roof plane correctness for objects larger than 10.0 m^2: 96.5%
Per-roof plane quality for objects larger than 10.0 m^2: 75.5%
The per-roof-plane-level evaluation is carried out as a function of the size of the roof plane. First, completeness, correctness, and quality are presented as a function of the roof plane area, i.e., these percentages are determined separately for all roof planes belonging to the corresponding area interval. After that, cumulative histograms are given. They show the quality numbers for all roof planes larger than the area corresponding to the respective histogram bin.
Evaluation on a per-roof plane level as a function of the roof plane area:
==========================================================================
Area [m^2], 5.0, 15.0, 25.0, 35.0, 45.0, 55.0, 65.0, 75.0, 85.0, 95.0, 105.0, 115.0,>120.0
Completeness, 62.0, 67.2, 83.3, 74.2, 86.7, 100.0, 60.0, 100.0, 100.0, 100.0, 0.0, 100.0, 87.5,
Correctness , 100.0, 97.6, 91.7, 94.7, 100.0, 100.0, 100.0, 100.0, 100.0, 100.0, 100.0, , 100.0,
Quality , 62.0, 66.1, 77.5, 71.3, 86.7, 100.0, 60.0, 100.0, 100.0, 100.0, 0.0, , 87.5,
Evaluation on a per-roof plane level as a function of the roof plane area (cumulative):
=======================================================================================
Area [m^2], 5.0, 15.0, 25.0, 35.0, 45.0, 55.0, 65.0, 75.0, 85.0, 95.0, 105.0, 115.0,>120.0
Completeness, 72.2, 77.7, 83.1, 82.9, 88.2, 88.9, 85.2, 90.9, 90.0, 88.2, 80.0, 88.9, 87.5,
Correctness , 96.7, 96.5, 96.0, 98.5, 100.0, 100.0, 100.0, 100.0, 100.0, 100.0, 100.0, 100.0, 100.0,
Quality , 70.5, 75.5, 80.3, 81.9, 88.2, 88.9, 85.2, 90.9, 90.0, 88.2, 80.0, 88.9, 87.5,
Again, these histogram can be converted into a graph easily using MS Excel.
This is followed by a histogram of the areas of the roof planes in the reference and then by histograms of roof planes that were either classified as TP, FP, or FN.
Histogram of area coverage of all roof planes in the reference:
===============================================================
Area[m^2], 5.0, 15.0, 25.0, 35.0, 45.0, 55.0, 65.0, 75.0, 85.0, 95.0, 105.0, 115.0,>120.0
, 100, 64, 42, 31, 15, 9, 5, 2, 3, 7, 1, 1, 8,
Histogram of area coverage of true positives (reference):
=========================================================
Area[m^2], 5.0, 15.0, 25.0, 35.0, 45.0, 55.0, 65.0, 75.0, 85.0, 95.0, 105.0, 115.0,>120.0
, 62, 43, 35, 23, 13, 9, 3, 2, 3, 7, 0, 1, 7,
Histogram of area coverage of true positives (extraction results):
==================================================================
Area[m^2], 5.0, 15.0, 25.0, 35.0, 45.0, 55.0, 65.0, 75.0, 85.0, 95.0, 105.0, 115.0,>120.0
, 10, 40, 33, 18, 11, 7, 7, 3, 5, 2, 3, 0, 8,
Histogram of area coverage of false negatives:
==============================================
Area[m^2], 5.0, 15.0, 25.0, 35.0, 45.0, 55.0, 65.0, 75.0, 85.0, 95.0, 105.0, 115.0,>120.0
, 38, 21, 7, 8, 2, 0, 2, 0, 0, 0, 1, 0, 1,
Histogram of area coverage of false positives:
==============================================
Area[m^2], 5.0, 15.0, 25.0, 35.0, 45.0, 55.0, 65.0, 75.0, 85.0, 95.0, 105.0, 115.0,>120.0
, 0, 1, 3, 1, 0, 0, 0, 0, 0, 0, 0, 0, 0,
The last section of the evaluation file corresponds to the evaluation on a per-building basis. First, the total number of buildings in the reference is given. This is followed by the number of buildings in the reference for which all roof planes could be detected as TP (according to the definition above); this is done separately considering only roof planes larger than a given threshold (2.5 m2 in the example) are considered. Finally, the number of reference buildings for which all detected roof planes were correct are reported, again first considering all planes and then only the planes larger than a given threshold.
Evaluation on a per-building level:
===================================
Total number of buildings in the reference: 37
Number of reference buildings with all roof planes detected: 6
Number of reference buildings with all roof planes larger than 2.5 m^2 detected: 7
Number of reference buildings where all detected roof planes are correct: 24
Number of reference buildings where all roof planes larger than 2.5 m^2 are correct: 24
The entire file is listed in the appendix.
Rottensteiner, F., Trinder, J., Clode, S., Kubik, K., 2005. Using the Dempster-Shafer method for the fusion of LIDAR data and multi-spectral images for building detection. Information Fusion 6(4):283-300.
Rutzinger, M., Rottensteiner, F. Pfeifer, N., 2009. A comparison of evaluation techniques for building extraction from airborne laser scanning. IEEE Journal of Selected Topics in Applied Earth Observations and Remote Sensing 2(1):11-20.
Appendix: Sample file with evaluation of roof reconstruction results:
Evaluation of building reconstruction results
=============================================
Number of roof planes in the reference: 288
Number of roof planes in the reconstruction results: 156 (152 inside the boundary)
Thresholds for overlap criterion:
=================================
None vs Weak [%]: 10.0
Weak vs Partial [%]: 50.0
Partial vs Strong [%]: 80.0
Evaluation of Geometrical Accuracy:
===================================
Distance threshold: 3.0 [m]
Total RMS of extracted boundaries: 0.79 [m] (determined from 943 of 997 possible correspondences)
Total RMS of centres of gravity of extracted objects (X / Y): 0.77 [m] / 0.76 [m] (determined from 140 of 151 possible correspondences)
Total RMS of reference boundaries: 0.95 [m] (determined from 1392 of 1891 possible correspondences)
Total RMS of centres of gravity of reference objects (X / Y): 0.88 [m] / 0.96 [m] (determined from 184 of 215 possible correspondences)
Histogram of RMS of extracted boundaries, 0.05, 0.15, 0.25, 0.35, 0.45, 0.55, 0.65, 0.75, 0.85, 0.95, 1.05, 1.15, 1.25, 1.35, 1.45, 1.55, 1.65, 1.75, 1.85, 1.95, 2.05, 2.15, 2.25, 2.35, 2.45, 2.55, 2.65, 2.75, 2.85, 2.95,>3.00
, 1, 16, 22, 24, 28, 23, 22, 17, 14, 11, 10, 9, 5, 4, 3, 4, 1, 5, 5, 1, 1, 0, 0, 0, 0, 1, 0, 0, 0, 1, 0,
Histogram of RMS of reference boundaries, 0.05, 0.15, 0.25, 0.35, 0.45, 0.55, 0.65, 0.75, 0.85, 0.95, 1.05, 1.15, 1.25, 1.35, 1.45, 1.55, 1.65, 1.75, 1.85, 1.95, 2.05, 2.15, 2.25, 2.35, 2.45, 2.55, 2.65, 2.75, 2.85, 2.95,>3.00
, 12, 8, 21, 15, 11, 15, 15, 22, 22, 14, 11, 10, 4, 2, 2, 7, 7, 3, 5, 3, 3, 5, 4, 2, 2, 0, 0, 0, 2, 1, 0,
Height errors: Total RMS of height differences between planes: 0.65 m^2
RMS of height differences between planes found to correspond: 0.25 m^2
Comparison of the topology of the two sets of roof planes:
==========================================================
Objects with a correspondence of 1 : 1 (reference : results): 83
Ref: 10; Res: 63; Ref: 11; Res: 65; Ref: 12; Res: 68; Ref: 23; Res: 28; Ref: 24; Res: 24; Ref: 25; Res: 26; Ref: 26; Res: 23;
Ref: 30; Res: 20; Ref: 31; Res: 17; Ref: 32; Res: 19; Ref: 35; Res: 18; Ref: 42; Res: 98; Ref: 48; Res: 111; Ref: 52; Res: 115;
Ref: 61; Res: 136; Ref: 65; Res: 95; Ref: 72; Res: 71; Ref: 82; Res: 59; Ref: 83; Res: 44; Ref: 84; Res: 51; Ref: 89; Res: 45;
Ref: 95; Res: 43; Ref: 96; Res: 50; Ref: 97; Res: 72; Ref: 98; Res: 75; Ref: 99; Res: 76; Ref: 101; Res: 74; Ref: 105; Res: 108;
Ref: 107; Res: 110; Ref: 109; Res: 109; Ref: 116; Res: 78; Ref: 117; Res: 80; Ref: 118; Res: 79; Ref: 122; Res: 94; Ref: 123; Res: 93;
Ref: 124; Res: 92; Ref: 129; Res: 32; Ref: 141; Res: 6; Ref: 142; Res: 56; Ref: 143; Res: 55; Ref: 149; Res: 12; Ref: 159; Res: 13;
Ref: 163; Res: 8; Ref: 164; Res: 16; Ref: 168; Res: 14; Ref: 169; Res: 3; Ref: 170; Res: 10; Ref: 173; Res: 11; Ref: 175; Res: 52;
Ref: 176; Res: 37; Ref: 179; Res: 38; Ref: 180; Res: 40; Ref: 181; Res: 33; Ref: 190; Res: 62; Ref: 195; Res: 86; Ref: 196; Res: 89;
Ref: 197; Res: 85; Ref: 198; Res: 88; Ref: 203; Res: 87; Ref: 205; Res: 83; Ref: 207; Res: 101; Ref: 216; Res: 119; Ref: 217; Res: 118;
Ref: 219; Res: 123; Ref: 220; Res: 120; Ref: 248; Res: 150; Ref: 249; Res: 149; Ref: 250; Res: 147; Ref: 253; Res: 151; Ref: 254; Res: 148;
Ref: 260; Res: 141; Ref: 261; Res: 142; Ref: 262; Res: 143; Ref: 266; Res: 138; Ref: 271; Res: 126; Ref: 272; Res: 133; Ref: 274; Res: 130;
Ref: 279; Res: 144; Ref: 283; Res: 125; Ref: 285; Res: 124; Ref: 286; Res: 131; Ref: 287; Res: 129; Ref: 288; Res: 27;
Objects with a correspondence of 1 : M (reference : results): 7
Reference: 49 ; Results: 116 / 114
Reference: 71 ; Results: 81 / 82
Reference: 125 ; Results: 90 / 91
Reference: 185 ; Results: 35 / 36
Reference: 208 ; Results: 103 / 102
Reference: 265 ; Results: 137 / 139
Reference: 282 ; Results: 128 / 134
Objects with a correspondence of M : 1 (reference : results): 42
Results: 1 ; Reference: 157 / 160 / 174
Results: 2 ; Reference: 165 / 166 / 167
Results: 4 ; Reference: 140 / 139
Results: 5 ; Reference: 158 / 162
Results: 7 ; Reference: 156 / 155 / 154
Results: 9 ; Reference: 148 / 152 / 153
Results: 15 ; Reference: 134 / 137 / 136 / 135 / 138
Results: 21 ; Reference: 5 / 7
Results: 22 ; Reference: 6 / 8 / 4
Results: 25 ; Reference: 27 / 28
Results: 30 ; Reference: 131 / 130
Results: 34 ; Reference: 178 / 186 / 177
Results: 42 ; Reference: 103 / 91
Results: 46 ; Reference: 86 / 85
Results: 49 ; Reference: 93 / 94
Results: 53 ; Reference: 147 / 144
Results: 54 ; Reference: 146 / 145
Results: 57 ; Reference: 81 / 79
Results: 58 ; Reference: 80 / 77 / 78 / 76 / 75
Results: 60 ; Reference: 189 / 188
Results: 61 ; Reference: 191 / 192
Results: 64 ; Reference: 16 / 19
Results: 66 ; Reference: 14 / 20
Results: 67 ; Reference: 13 / 21
Results: 69 ; Reference: 9 / 17 / 18
Results: 84 ; Reference: 204 / 201 / 200 / 199
Results: 96 ; Reference: 64 / 73 / 74
Results: 97 ; Reference: 36 / 41 / 40 / 39 / 46
Results: 99 ; Reference: 43 / 38 / 47 / 37
Results: 100 ; Reference: 206 / 212
Results: 106 ; Reference: 112 / 108
Results: 107 ; Reference: 104 / 111 / 113 / 114
Results: 117 ; Reference: 53 / 54
Results: 121 ; Reference: 213 / 223
Results: 122 ; Reference: 221 / 222
Results: 127 ; Reference: 280 / 281 / 277 / 276 / 270
Results: 132 ; Reference: 273 / 275
Results: 135 ; Reference: 60 / 62
Results: 140 ; Reference: 263 / 264
Results: 145 ; Reference: 244 / 245 / 246
Results: 146 ; Reference: 252 / 251 / 247
Results: 152 ; Reference: 259 / 257
Object tuples with a correspondence of M : N (reference : results): 6
Reference: 132 / 128 / 127; Results : 29 / 31
Reference: 183 / 184; Results : 41 / 39
Reference: 87 / 90; Results : 47 / 48
Reference: 102 / 100; Results : 73 / 77
Reference: 209 / 211; Results : 105 / 104
Reference: 56 / 55; Results : 113 / 112
Histogram of overlap of reference roof planes
=============================================
Histogram of overlap of reference roof planes , 2.5, 7.5, 12.5, 17.5, 22.5, 27.5, 32.5, 37.5, 42.5, 47.5, 52.5, 57.5, 62.5, 67.5, 72.5, 77.5, 82.5, 87.5, 92.5, 97.5,>100.0
, 73, 0, 0, 0, 0, 0, 1, 1, 2, 1, 4, 10, 8, 6, 14, 19, 9, 27, 30, 37, 46,
Histogram of overlap of detected roof planes
============================================
Histogram of overlap of detected roof planes , 2.5, 7.5, 12.5, 17.5, 22.5, 27.5, 32.5, 37.5, 42.5, 47.5, 52.5, 57.5, 62.5, 67.5, 72.5, 77.5, 82.5, 87.5, 92.5, 97.5,>100.0
, 1, 0, 0, 0, 0, 0, 1, 0, 2, 1, 2, 2, 6, 8, 6, 7, 16, 22, 24, 26, 28,
Evaluation on a per-area level (pixel size: 0.100 m)
=====================================================
Number of object pixels (reference): 652721( 6527.2 m^2)
Number of object pixels (detection results): 559881( 5598.8 m^2)
Number of true positives: 549104( 5491.0 m^2)
Number of false positives: 10777( 107.8 m^2)
Number of false negatives: 103617( 1036.2 m^2)
Number of true negatives: 2331702( 23317.0 m^2)
Per-area completeness: 84.1%
Per-area correctness: 98.1%
Per-area quality: 82.8%
Evaluation on a per-roof plane level (Threshold for classification as a true positive: 50.0%
============================================================================================
Number of roof planes (reference): 288( 6527.2 m^2)
Number of detected roof planes: 152( 5598.8 m^2)
Number of true positive reference roof planes: 208( 5437.1 m^2)
Number of true positive detected roof planes: 147( 5505.0 m^2)
Number of false positives: 5( 93.8 m^2)
Number of false negatives: 80( 1090.1 m^2)
Per-roof plane completeness: 72.2%
Per-roof plane correctness: 96.7%
Per-roof plane quality: 70.5%
Per-roof plane completeness balanced by area: 83.3%
Per-roof plane object correctness balanced by area: 98.3%
Per-roof plane object quality balanced by area: 82.1%
Per-roof plane completeness for objects larger than 10.0 m^2: 77.7%
Per-roof plane correctness for objects larger than 10.0 m^2: 96.5%
Per-roof plane quality for objects larger than 10.0 m^2: 75.5%
Evaluation on a per-roof plane level as a function of the roof plane area:
==========================================================================
Area [m^2], 5.0, 15.0, 25.0, 35.0, 45.0, 55.0, 65.0, 75.0, 85.0, 95.0, 105.0, 115.0,>120.0
Completeness, 62.0, 67.2, 83.3, 74.2, 86.7, 100.0, 60.0, 100.0, 100.0, 100.0, 0.0, 100.0, 87.5,
Correctness , 100.0, 97.6, 91.7, 94.7, 100.0, 100.0, 100.0, 100.0, 100.0, 100.0, 100.0, , 100.0,
Quality , 62.0, 66.1, 77.5, 71.3, 86.7, 100.0, 60.0, 100.0, 100.0, 100.0, 0.0, , 87.5,
Evaluation on a per-roof plane level as a function of the roof plane area (cumulative):
=======================================================================================
Area [m^2], 5.0, 15.0, 25.0, 35.0, 45.0, 55.0, 65.0, 75.0, 85.0, 95.0, 105.0, 115.0,>120.0
Completeness, 72.2, 77.7, 83.1, 82.9, 88.2, 88.9, 85.2, 90.9, 90.0, 88.2, 80.0, 88.9, 87.5,
Correctness , 96.7, 96.5, 96.0, 98.5, 100.0, 100.0, 100.0, 100.0, 100.0, 100.0, 100.0, 100.0, 100.0,
Quality , 70.5, 75.5, 80.3, 81.9, 88.2, 88.9, 85.2, 90.9, 90.0, 88.2, 80.0, 88.9, 87.5,
Histogram of area coverage of all roof planes in the reference:
===============================================================
Area[m^2], 5.0, 15.0, 25.0, 35.0, 45.0, 55.0, 65.0, 75.0, 85.0, 95.0, 105.0, 115.0,>120.0
, 100, 64, 42, 31, 15, 9, 5, 2, 3, 7, 1, 1, 8,
Histogram of area coverage of true positives (reference):
=========================================================
Area[m^2], 5.0, 15.0, 25.0, 35.0, 45.0, 55.0, 65.0, 75.0, 85.0, 95.0, 105.0, 115.0,>120.0
, 62, 43, 35, 23, 13, 9, 3, 2, 3, 7, 0, 1, 7,
Histogram of area coverage of true positives (extraction results):
==================================================================
Area[m^2], 5.0, 15.0, 25.0, 35.0, 45.0, 55.0, 65.0, 75.0, 85.0, 95.0, 105.0, 115.0,>120.0
, 10, 40, 33, 18, 11, 7, 7, 3, 5, 2, 3, 0, 8,
Histogram of area coverage of false negatives:
==============================================
Area[m^2], 5.0, 15.0, 25.0, 35.0, 45.0, 55.0, 65.0, 75.0, 85.0, 95.0, 105.0, 115.0,>120.0
, 38, 21, 7, 8, 2, 0, 2, 0, 0, 0, 1, 0, 1,
Histogram of area coverage of false positives:
==============================================
Area[m^2], 5.0, 15.0, 25.0, 35.0, 45.0, 55.0, 65.0, 75.0, 85.0, 95.0, 105.0, 115.0,>120.0
, 0, 1, 3, 1, 0, 0, 0, 0, 0, 0, 0, 0, 0,
Evaluation on a per-building level:
===================================
Total number of buildings in the reference: 37
Number of reference buildings with all roof planes detected: 6
Number of reference buildings with all roof planes larger than 2.5 m^2 detected: 7
Number of reference buildings where all detected roof planes are correct: 24
Number of reference buildings where all roof planes larger than 2.5 m^2 are correct: 24