Introduction
Driven by the same motivation we had when preparing the 2D labeling data we decided to define a 3D semantic labeling contest, as well. A similar initiative is hosted by the IQumulus project in combination with the TerraMobilita project by IGN. While that benchmark is providing mobile mapping data, we are working with airborne data.
The airborne laser scanning data from Vaihingen used for the (still ongoing) urban classification and 3D reconstruction benchmark of our working group will also be used for the 3D labeling challenge. The points have not been rasterized or post processed. In total 9 classes have been defined and each point in the dataset is labeled accordingly. The reference labels were received from the authors of (Niemeyer et al., 2014).
The area is subdivided into two parts, and for each a simple ASCII file with XYZ coordinates, reflectance and return count information is provided. For one area we will provide reference information, while in the second area we will use the reference for the evaluation of participants' results.
The classes are (id in reference file, name)
0 Powerline
1 Low vegetation
2 Impervious surfaces
3 Car
4 Fence/Hedge
5 Roof
6 Facade
7 Shrub
8 Tree
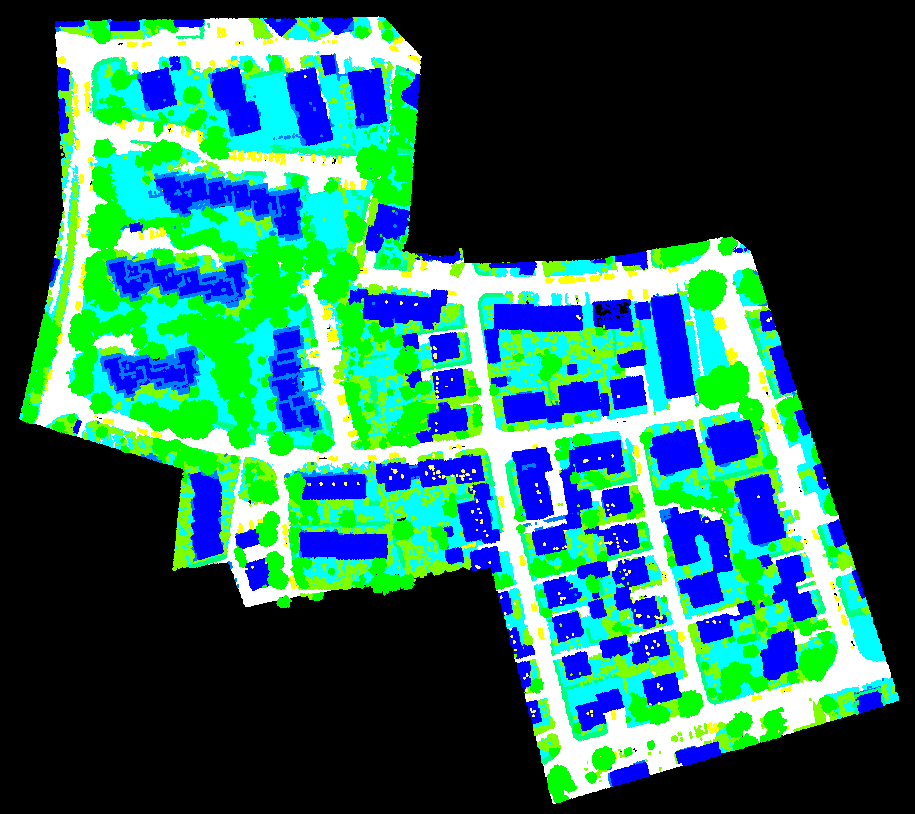
Example view on the Training area (color codes the label)
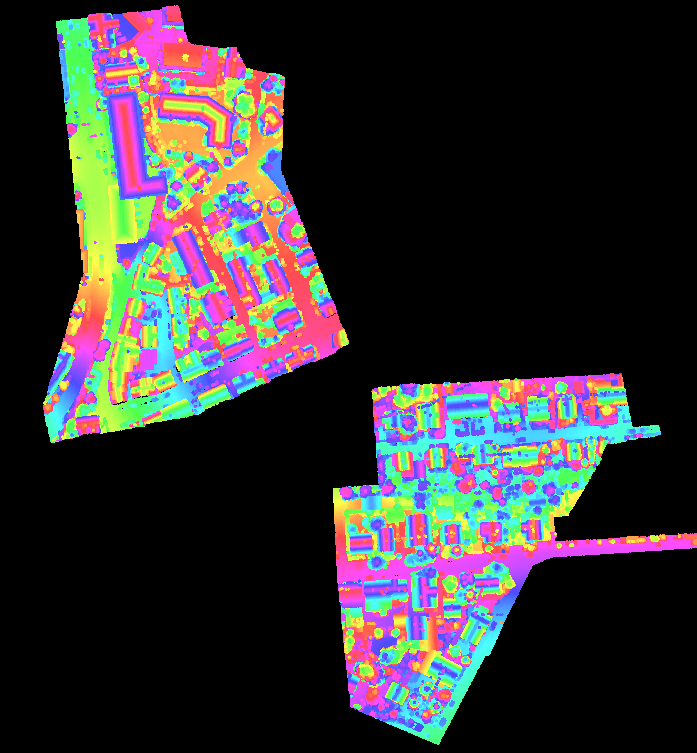
View onto 3D data provided for evaluation (color codes the height)
Submission of results
Participants are expected to deliver for each point in the test area a list of XYZ coordinates and for each point a label assigned. The sequence of points can be different compared to the provided file, but the precision of points should not be altered too much to enable a reliable closest point search to our reference.
Example:
497074.93 5419772.04 266.04 1
497074.93 5419772.08 266.02 5
497074.93 5419772.09 266.05 0
A zipped text file with this information should be send to m.gerke@tu-bs.de
Omission of classes / points
In contrast to the 2D labeling challenge we allow participants to provide only partial data, i.e. to omit classes and points in the delivered data. If you for instance only classify vegetation it is allowed to just provide the points you labeled with ID 1,7,8. Of course, during evaluation false positive and false negative classifications will be revealed and considered, as well.
Evaluation of results
We will employ the same methodology for the evaluation as explained in the 2D case. Each point in the reference induces an entry in the confusion matrix, however, a buffered reference like in the 2D case will not be used. Special attention needs to be paid for non-delivered points. If missing points are actually part of a delivered class, they contribute to the False Negative count.
References
Niemeyer, J.; Rottensteiner, F.; Sörgel, U. (2014): Contextual classification of lidar data and building object detection in urban areas. ISPRS Journal of Photogrammetry and Remote Sensing, Vol. 87, January 2014, pp 152-165