Additional data:
Digital Surface Model and Digital Terrain Model
Download here a zip-tar file (12 Mb) with all the additional information (2 DSMs, 1 DTM, the buildings as DXF, DGN and DWG files,6 object points for each cut-out with object and pixel coordinates).
1. Digital Surface Model
Two DSMs are distributed optional as examples of the results obtainable automatically without manual
editing with commercial software. As opposed to a DTM, the DSM includes modelling of the surface of all entities
e.g. buildings, and not just the terrain. It was computed using a pyramid-based correlation technique on the
Virtuozo. Figures 6 and 8 illustrates these DSMs represented as grey level images, and Figures 7 and 9 show
the same date shaded and artificial coloured to better show the elevation variations. The bright blobs in the
grey level images represent the higher points, e.g. houses and tree stands. The colour tables of both DSMs
are different, dark green signalises less elevation. Then bright green, yellow or brown. The DSM was
generated with a Patch size of 15 by 15 and column and row space of 15. The resulting grid has a resolution of 1m.
| 58_59_hoeng.dat |
DSM from 47009_2058.tif and 47009_2059.tif made with Virtuozo |
ASCII (x,y,z) |
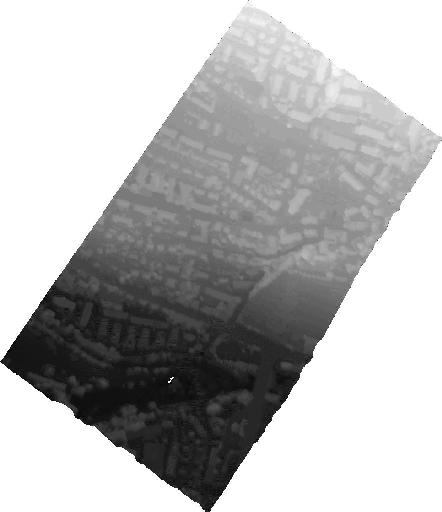
Fig. 6 Computed DSModels with Virtuozo Software 58_59_hoengg.dat
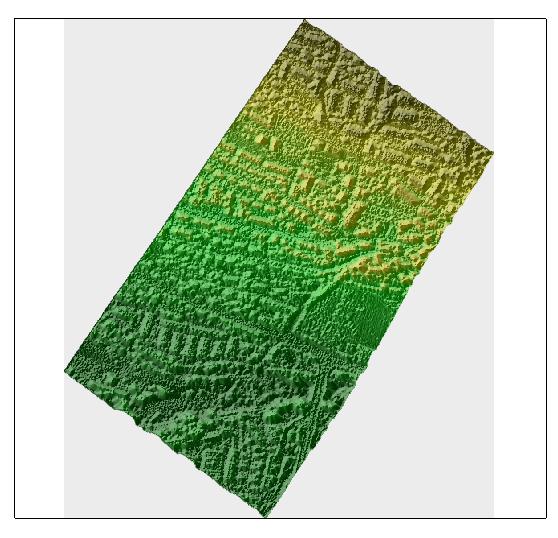
Fig. 7 Computed DSModels with Virtuozo Software 58_59_hoengg.dat
| North |
252284.0
|
| West |
679180.0
|
| East |
680146.0
|
| South |
250065.0
|
Table 2 Situation of the DSM in Swiss Landeskoordintensystem
| 87_88_hoeng.dat |
DSM from 47008_2087.tif and 47008_2088.tif made with Virtuozo |
ASCII (x,y,z) |
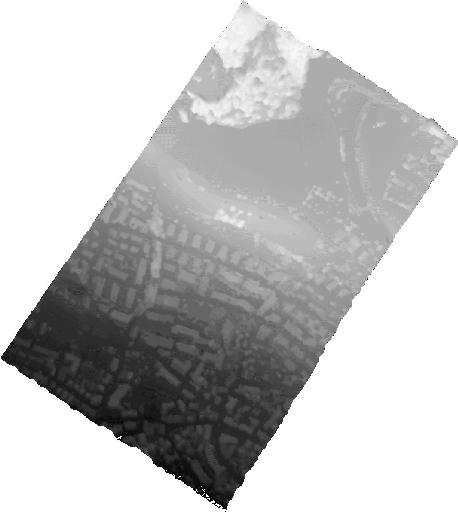
Fig. 8 Computed DSModels with Virtuozo Software 58_59_hoengg.dat
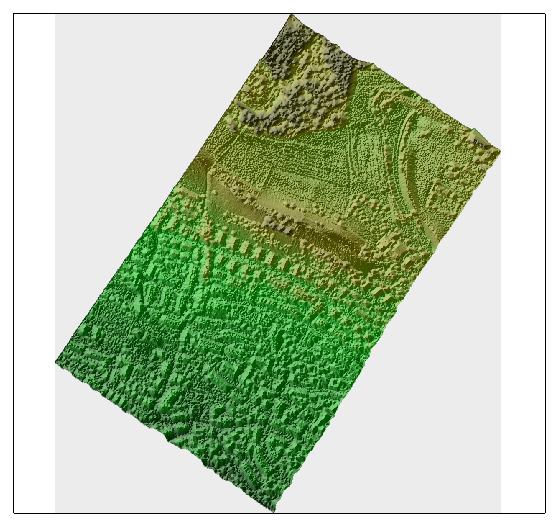
Fig. 9 Computed DSModels with Virtuozo Software 58_59_hoengg.dat
| North |
251664.0
|
| West |
679554.0
|
| East |
680521.0
|
| South |
250472.0
|
Table 3 Situation of the DSM in Swiss Landeskoordintensystem
2. Digital Terrain Model (DTM):
A separate ASCII file contains DTM information. The data given is the result of resampling the original
measurements on a 10 meter grid. The original data was manually measured on an AC3 analytical plotter.The
DTMs model (only) the terrain does not include the buildings.
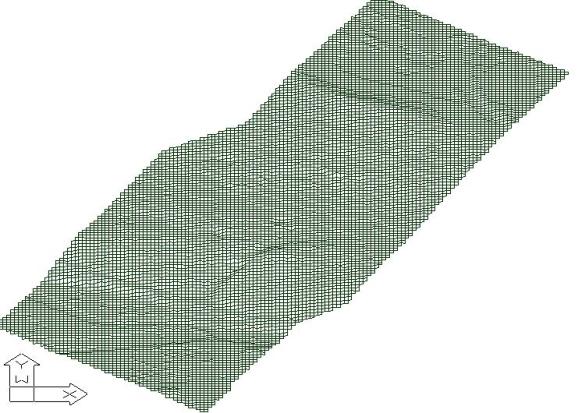
The slope of the terrain from the top of the hill at ETH Hoenggerberg down to the Limmat River is observable.
Fig. 10 DTM data shown as regular DXF grid
Buildings
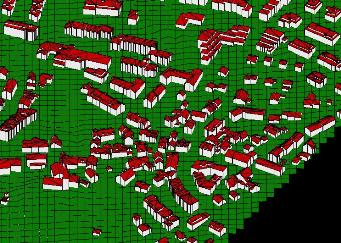
We provide also a reference dataset measurement, made by CyberCityModeller. A separate DXF file contains building roof models. These models are represented in terms of line entities measured by Cyber City Modeller.
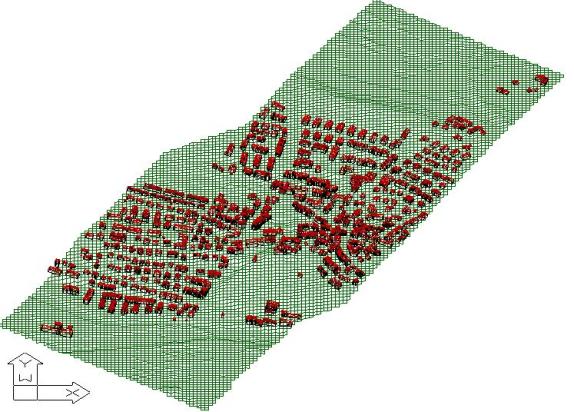
Fig. 11 DTM overlayed with DXF data of buildings, see details below
Back to Main Page
© Institute of Geodesy and Photogrammetry, ETH Zurich